


PHILADELPHIA, PA – For the recent PRO Rugby match between Denver and San Diego, Will Magie’s Attacking Effectiveness Rating (AR) was 4.81 while Kurt Morath’s was only 2.33. What’s that you say? You’ve never heard of AR? As far as I know, it hasn’t existed until just now.
How do we, all of us not part of a coaching staff, measure decision-making in attack? Right now we don’t. Most leagues collect data on the number of times a player kicks, runs, passes, and lots more. Some of that is even shared. (Because I think intelligent statistics make the game more interesting, I am baffled by why leagues don’t make it easier to access information.)
Even if we have that information, it doesn’t provide insight into whether or not the kick, pass, or carry was the right decision. In order to know more about the decision, we need to know about the outcome. Good outcomes suggest good decisions.
Individual teams, through their coaches and video analysts, can look at every decision a player made and evaluate its effectiveness. For those who can’t pore over every minute of every match, there is no easy way to know which players in a competition are making good decisions.
PRO Rugby has made a big investment in American rugby, and a lot of that investment is in the players. In order for the league to grow and do well, it is important to have a clear sense of what players are performing well and need to be offered contracts for Year 2. Quantitative measurements help us understand what is happening on the field and provide a check against whatever biases we bring to player observation. Therefore, we “need” a measure for how smart players are in attack.
There is nothing unique about PRO Rugby’s position. All employers have a serious incentive to retain productive employees. One thing which makes the PRO case unusual is that many of the players are virtually unknown to much of the audience.
A central assumption: Good decisions result in territory gained and/or possession retention. A secondary assumption: the right decision is not valuable unless it is executed reasonably well.
Measuring any individual player’s decision-making is problematic because rugby is a beautifully complex game in which the success of any one player is dependent on her 14 teammates. Any individual player’s rating could be helped dramatically by a brilliant move by a teammate to whom she’s passed. But that same player’s rating could be negatively affected by things beyond her control.
And of course, a side that is losing matches is likely to be losing territory and possession figures for most matches. Therefore, an individual making the best possible decisions on a bad team will “look” worse than a player making average decisions on a good team. If we had a rating for every player on a team, we’d at least know whose decisions were helping and hurting most.
Still, knowing that the game is complicated shouldn’t stop us from having a crack. That is why I am working on an Attacking Effectiveness Rating (AR). I welcome feedback on what I’m missing or what seems to work.
Here is where I started, and I tested my ideas by tracking Will Magie and Kurt Morath in the Denver v San Diego match. They both started at 10, so that seemed a good comparison. Looking at scrum half play is, perhaps, more interesting. But since the scrum halves have more touches, that’s more laborious. Maybe next week.
My thought was that I’d create one column and tally territory up – with some significant additions/subtractions. I noted the position of the player when he received the ball and the location of the next breakdown. The number of meters between those, was put into the column.
In the picture below, Morath has just received the ball about 46 meters from the attacking try zone (the try zone he’s trying to get to).
The next breakdown is 38 meters from the try zone, so that is +8 for Morath. Perhaps the +/- should be tallied from the previous breakdown?
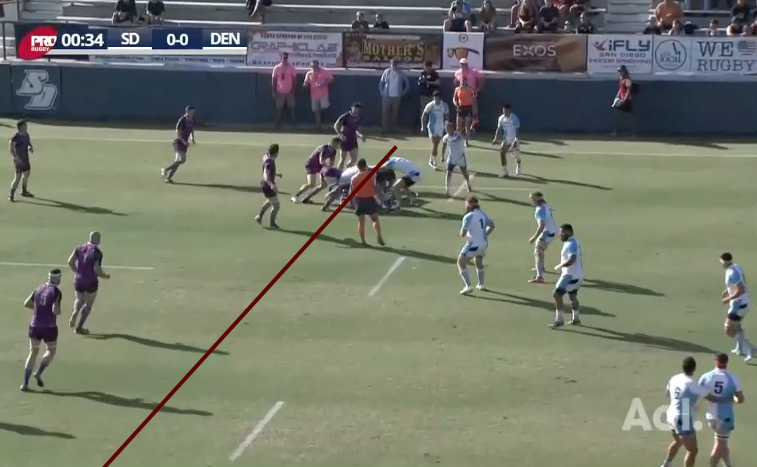
But the strength of decision isn’t limited to just that phase – a good decision puts the team into a strong position to continue the attack – so I also counted the next phase. San Diego went backward, so that’s -4.
The net for Morath for those 2 phases is +4. Perhaps the second phase should count half as much?
The decision of when to kick is also important. If a player kicks and possession is retained, that is simply +1 for every meter gained. If possession is lost, I divided the territory gained by 2. My thinking is that territory is valuable, but there must be a cost for handing over possession. I measured territory by noting the location of the kicker when he received the ball and the location of the next breakdown. If Magie kicked 50 meters to Mikey Te’o, who ran 30 meters before he was tackled, that is +10 for Magie (20 meters net divided by 2).
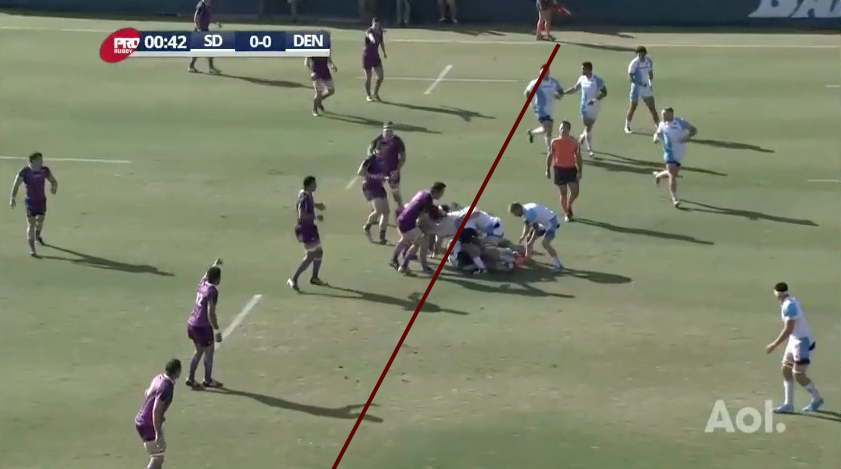
Here is Morath kicking. He took a step before he kicked, so the starting point is 56 meters from the attacking try zone.
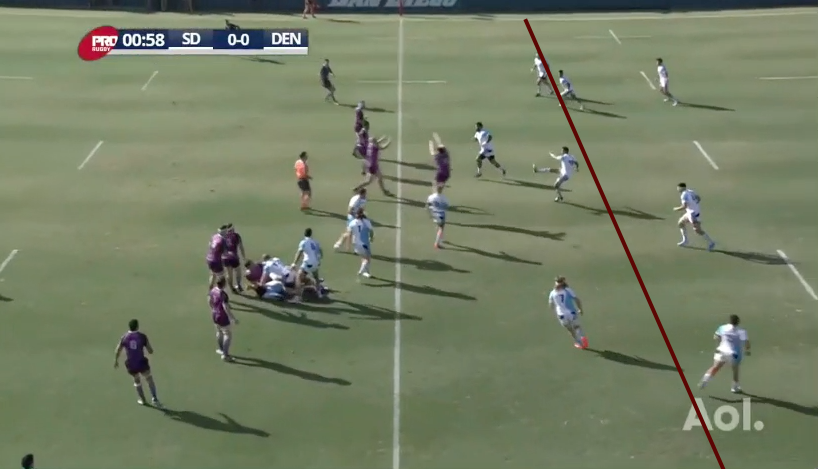
The kick was pretty good, and Tim Stanfill’s chase was quite good. Max de Achaval kicked from about the 5 meter line. The result is the lineout being formed below. That lineout is, effectively, the next breakdown.
It looks like that lineout is 29 meters from the try line. Morath started at 56 meters. That is a gain of 27 meters, and San Diego has possession. That +27 is a good number for Morath, though Stanfill had a lot to do with the amount of territory by chasing the kick well. Kicking when the chasers are ready is good decision-making, so while +27 is slightly flattering, he is still reaping the benefits of a good decision.
A pass that was forward or knocked on, or that went to ground and was gathered by the opposition, earned -10. If the ball was turned over at the next breakdown, -10; turned over at the second breakdown, -7. If the decision maker (Morath or Magie) contributed to a phase that ended with a try, +20. Viewed another way:
[supsystic-tables id=’70’]
The results? In this match, using the approach described here, Magie massively outplayed Morath. Maggie’s rating was 385; Morath’s was 158.5. Magie played the whole match, and Morath came off sometime around the 68′ mark. If their total is divided by minutes played, Magie still beats Morath, 4.81 to 2.33.
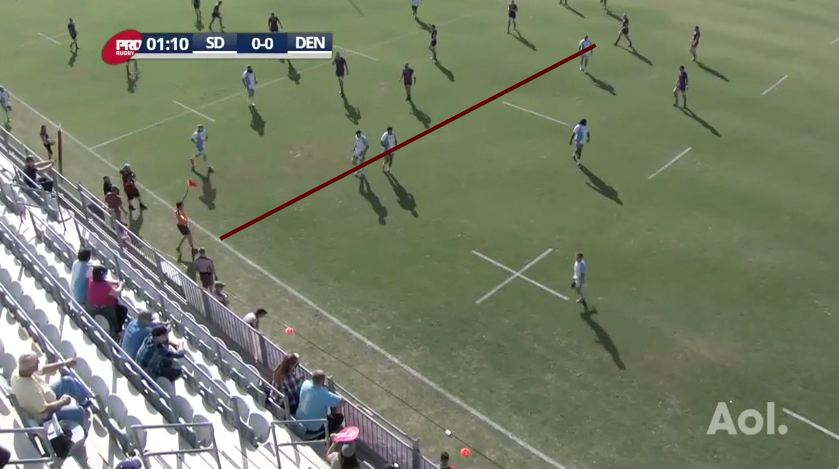
Does this rating pass the sniff test? Does it come close to capturing what we can see before we apply a number to their actions? I think so. Magie did have a few poor passes, but he also had a few beauties. There was the kick-pass that set-up Chad London’s try, but there were others like the one below. Blurrily, Magie is passing to London. He had options, and he picked the right one.

London gets the offload away and Denver score later in this phase. Magie gets +71 for territory gained in this phase and +20 because it ended in a try.
The first time I watched this match, Morath’s influence on the match seemed greater than Magie’s. I think that is because I’ve watched Morath more, and my watching on Sunday was influenced by the fact that I’ve already decided Morath is really good player while I’m still learning about Magie. Now that I’ve gone through the match for AR, it seems clear that Magie had the stronger match. It would be easy to diminish the contribution of Magie by pointing to the dominance of the Denver pack at the lineout (which heavily influenced the last 20 minutes of the match). That ease is why we need something like AR.
Some are likely to say that trying to apply metrics, like this, to individuals is attacking the team-first culture of rugby. Obviously, I think we can accurately understand the performance of individual players without losing sight of the value of teamwork and a culture of respect for the team.
I try to stay aware of what others are doing in terms of rugby related stats and data, but if you know of someone’s work I should know of, please speak up!
Please feel free to comment below, look for and “Like” our Facebook Rugby Wrap Up Page and follow us on Twitter@: RugbyWrapUp, Jake Frechette, Junoir Blaber, Ronan Nelson, Jamie Wall, James Harrington, DJ Eberle, Cody Kuxmann, Nick Hall, and Declan Yeats, respectively.