
GREENWICH, CT – Hang on, this won’t be a mathematics lesson… well not really. It’s more a continued and different look at Rugby Stats.
Unlike baseball, rugby has never been a sport so completely defined by statistics – in a modern, Sabermetrics way – that is. No one is making movies like Moneyball in New Zealand and Fantasy Rugby has a whisper of the popularity of its American counterparts of baseball, football, or basketball. Indeed, the three main stats that are most frequently talked about in rugby—caps, tries, and points—reveal little about the playing style or specific details of a team. Unless you go behind the scenes of a professional or national team, chances are these are the main stats you’ll hear in your day-to-day rugby discussions.
It is easy to see why baseball is a game of statistics. Singles, doubles, runs, stolen bases, etc. are very easy to count and record. However, rugby is a back and forth game, where the ball is in action much more and there are fewer stoppages of play. It’s just harder to calculate what’s going on. Rugby Wrap Up has been tinkering with new ways to look the game statistically and I wanted to join their number crunching team.
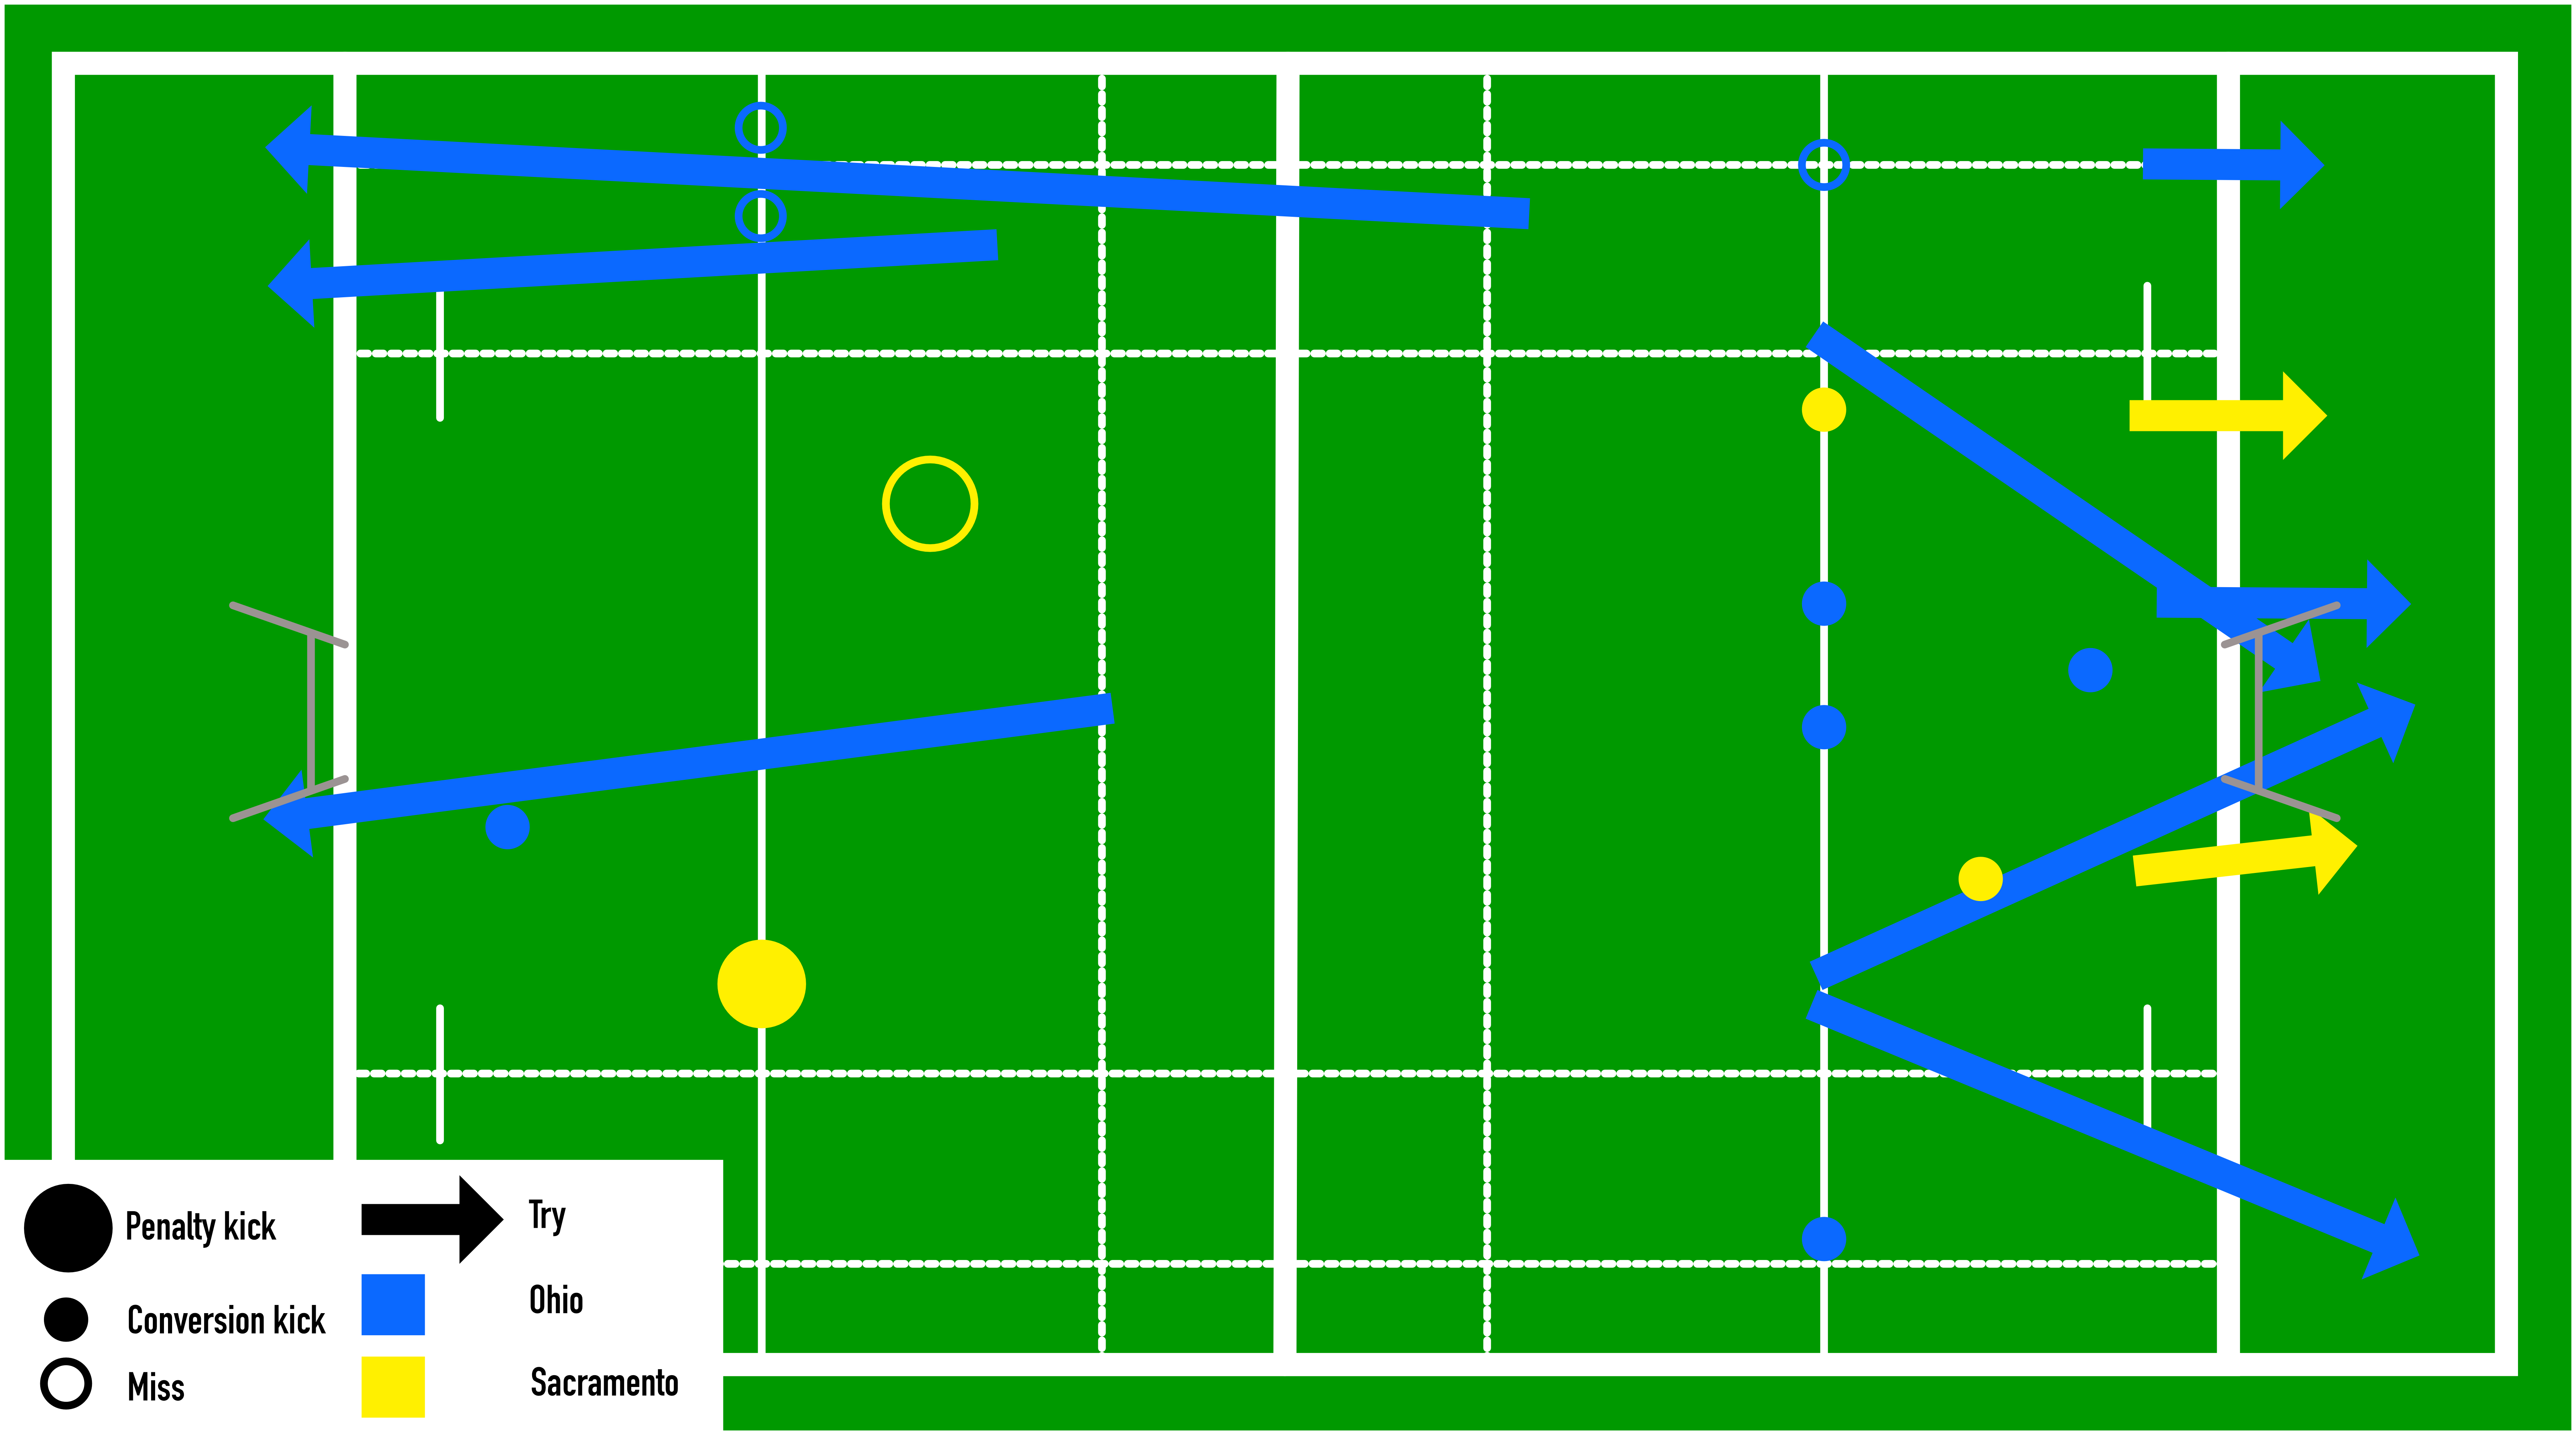
Penalties are one of the few things that are easy to count in rugby. Starting with this, I used the last Pro Rugby game to see how Ohio and Sacramento took advantage of the penalties they were given. Looking at the lopsided 50-17 win by Ohio, I thought that there had to be something specifically that Ohio was doing better than Sacramento other than just scoring more points.
The correlation between penalties and scoring seemed like a logical place to start. How often were teams capitalizing on penalties, or more specifically, what percentage of the time were teams scoring off penalties given to them in their attacking half of the field? Taking the number of tries and kicks at goal scored off of penalties divided by the total number of penalties given to that team in their attacking half shows how a team makes the most of their chances at scoring. Ohio held the advantage in this area by putting points on the board 36% of the time off of these penalties compared to Sacramento’s 18%. On top of that, Ohio had possession of the ball for 63% of the game and you can see why Sacramento wasn’t able to keep the game competitive. They didn’t have the opportunity to score and when they did they did not make the most of their opportunities.
However, some of Ohio’s tries were not scored off of penalties from the attacking half. Throughout the game Ohio had 6 line breaks compared to Sacramento’s 1. Ohio’s speedster Aaron “Spike” Davis was a weapon for Ohio and provided the team an attacking option from range.
Another key factor is ball retention. Counting the number of opportunities that a team unintentionally turned the ball over to the other team (not including penalties but rather an inaccurate pass or failing to get to the ruck in time) show the “stupid mistakes” a team made. I guess you could say Ohio was playing smarter as they only conceded 5 turnovers compared to Sacramento’s 13.
Look at this and then the analysis below.

Statistic:
Penalty difference (attacking half – conceded in defensive half)
Ohio- -5
Sacramento- +5
Scrum Success
Ohio- 50%
Sacramento- 57%
Lineout Success
Ohio- 62%
Sacramento- 54%
Points from attacking penalties (scoring plays from penalties/penalties in attacking half)
Ohio- 36%
Sacramento- 18%
Ball possession
Ohio- Possession of ball 63%
Sacramento- 37%
Line Breaks
Ohio- 6
Sacramento- 1
Turnovers (other team get ball unintentionally with no penalty)
Ohio- 5
Sacramento- 13
That’s a start at least. With more stats to compile this weekend, it’ll give us a better picture of the rest of the teams in the league and a chance to predict games and rank teams going forward. We’ll develop things more as we go. If you or someone you know might be interested in adding to the Numbers Stew, let us know. Any criticisms/suggestions are welcome.
FYI: If you can’t make it to today’s San Diego vs Sacramento match, you can watch the live stream. This is the link.
Again, please feel free to comment below, look for and “Like” our Facebook Rugby Wrap Up Page and follow us on Twitter@: Luke Bienstock, RugbyWrapUp, Junoir Blaber, @MeetTheMatts, Ronan Nelson, Crawford Miller, James Harrington and Declan Yeats.

