


 GREENWICH, CT – The Denver Stampede just barely got past the Ohio Aviators in the league standings to claim the inaugural PRO Rugby Championship. While those two sides were dominant this year, let’s look into what they specifically did so well, and what the some of the other teams struggled with. However, since we only got our hamsters on the RWU Stats Wheel in week 7, this total is from the second half of the season. And before we go further, please check out our handy-dandy PRO Rugby Stats Glossary:
- Average Penalty Points (APP) – Number of times points are scored off of penalties in the attacking half of the field divided by total penalties awarded in attacking side
- Defensive Hold Average (DHA) – Number of times a team repels its opponent within it’s own 22 meter divided by the number of times opponent enters within 22 meter line.
- Red Zone Point Average (RPA) – Number of times a team gets points when it goes inside the 22 meter line divided by the number of time that team is inside the 22 meter line.
- Attacking Plays – Offloads plus line breaks plus runs >20 meters plus plays of >50 meters
- Penalty Difference – Penalties awarded divided by penalties conceded
- Turnovers – Times the ball changes possession not including penalties. Ex. counter ruck, interception, stolen lineout, etc.
When looking at all of the teams, all but Denver had average ball possession for less than 50% of the match. The Stampede, on the other hand, had a whopping 59% this season. That makes sense when you think of their style of play. Using the strength of its forwards, like young Hanco Germishuys and veteran Pedrie Wannenburg, Denver was able to control the possession for long amounts of time while slowly making progress up the field.
Two stats that stood out for Ohio and Denver was their Attacking Plays and RPA. The Aviators had 121 and 62% and the Stampede had 114 and 58%, respectively. Leading the league in this category highlights the ability of both teams make big plays to spark the attack and finish when they have the opportunity to score. That’s easier said than done.
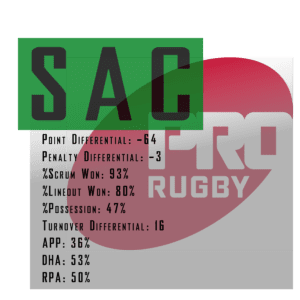
Interestingly, Sacramento led in some key categories. The Express came in first with its 53% DHA and +16 Turnover Differential. Despite these impressive defensive stats, the Express couldn’t find itself offensively, coming in next to last in Attacking Plays at 85, and RPA at 50%.
The Breakers struggled with turnovers and point differential at -18 and -120. All along, we emphasized the importance of winning the turnover battle. If you lose ’em, things aren’t likely to go your way.
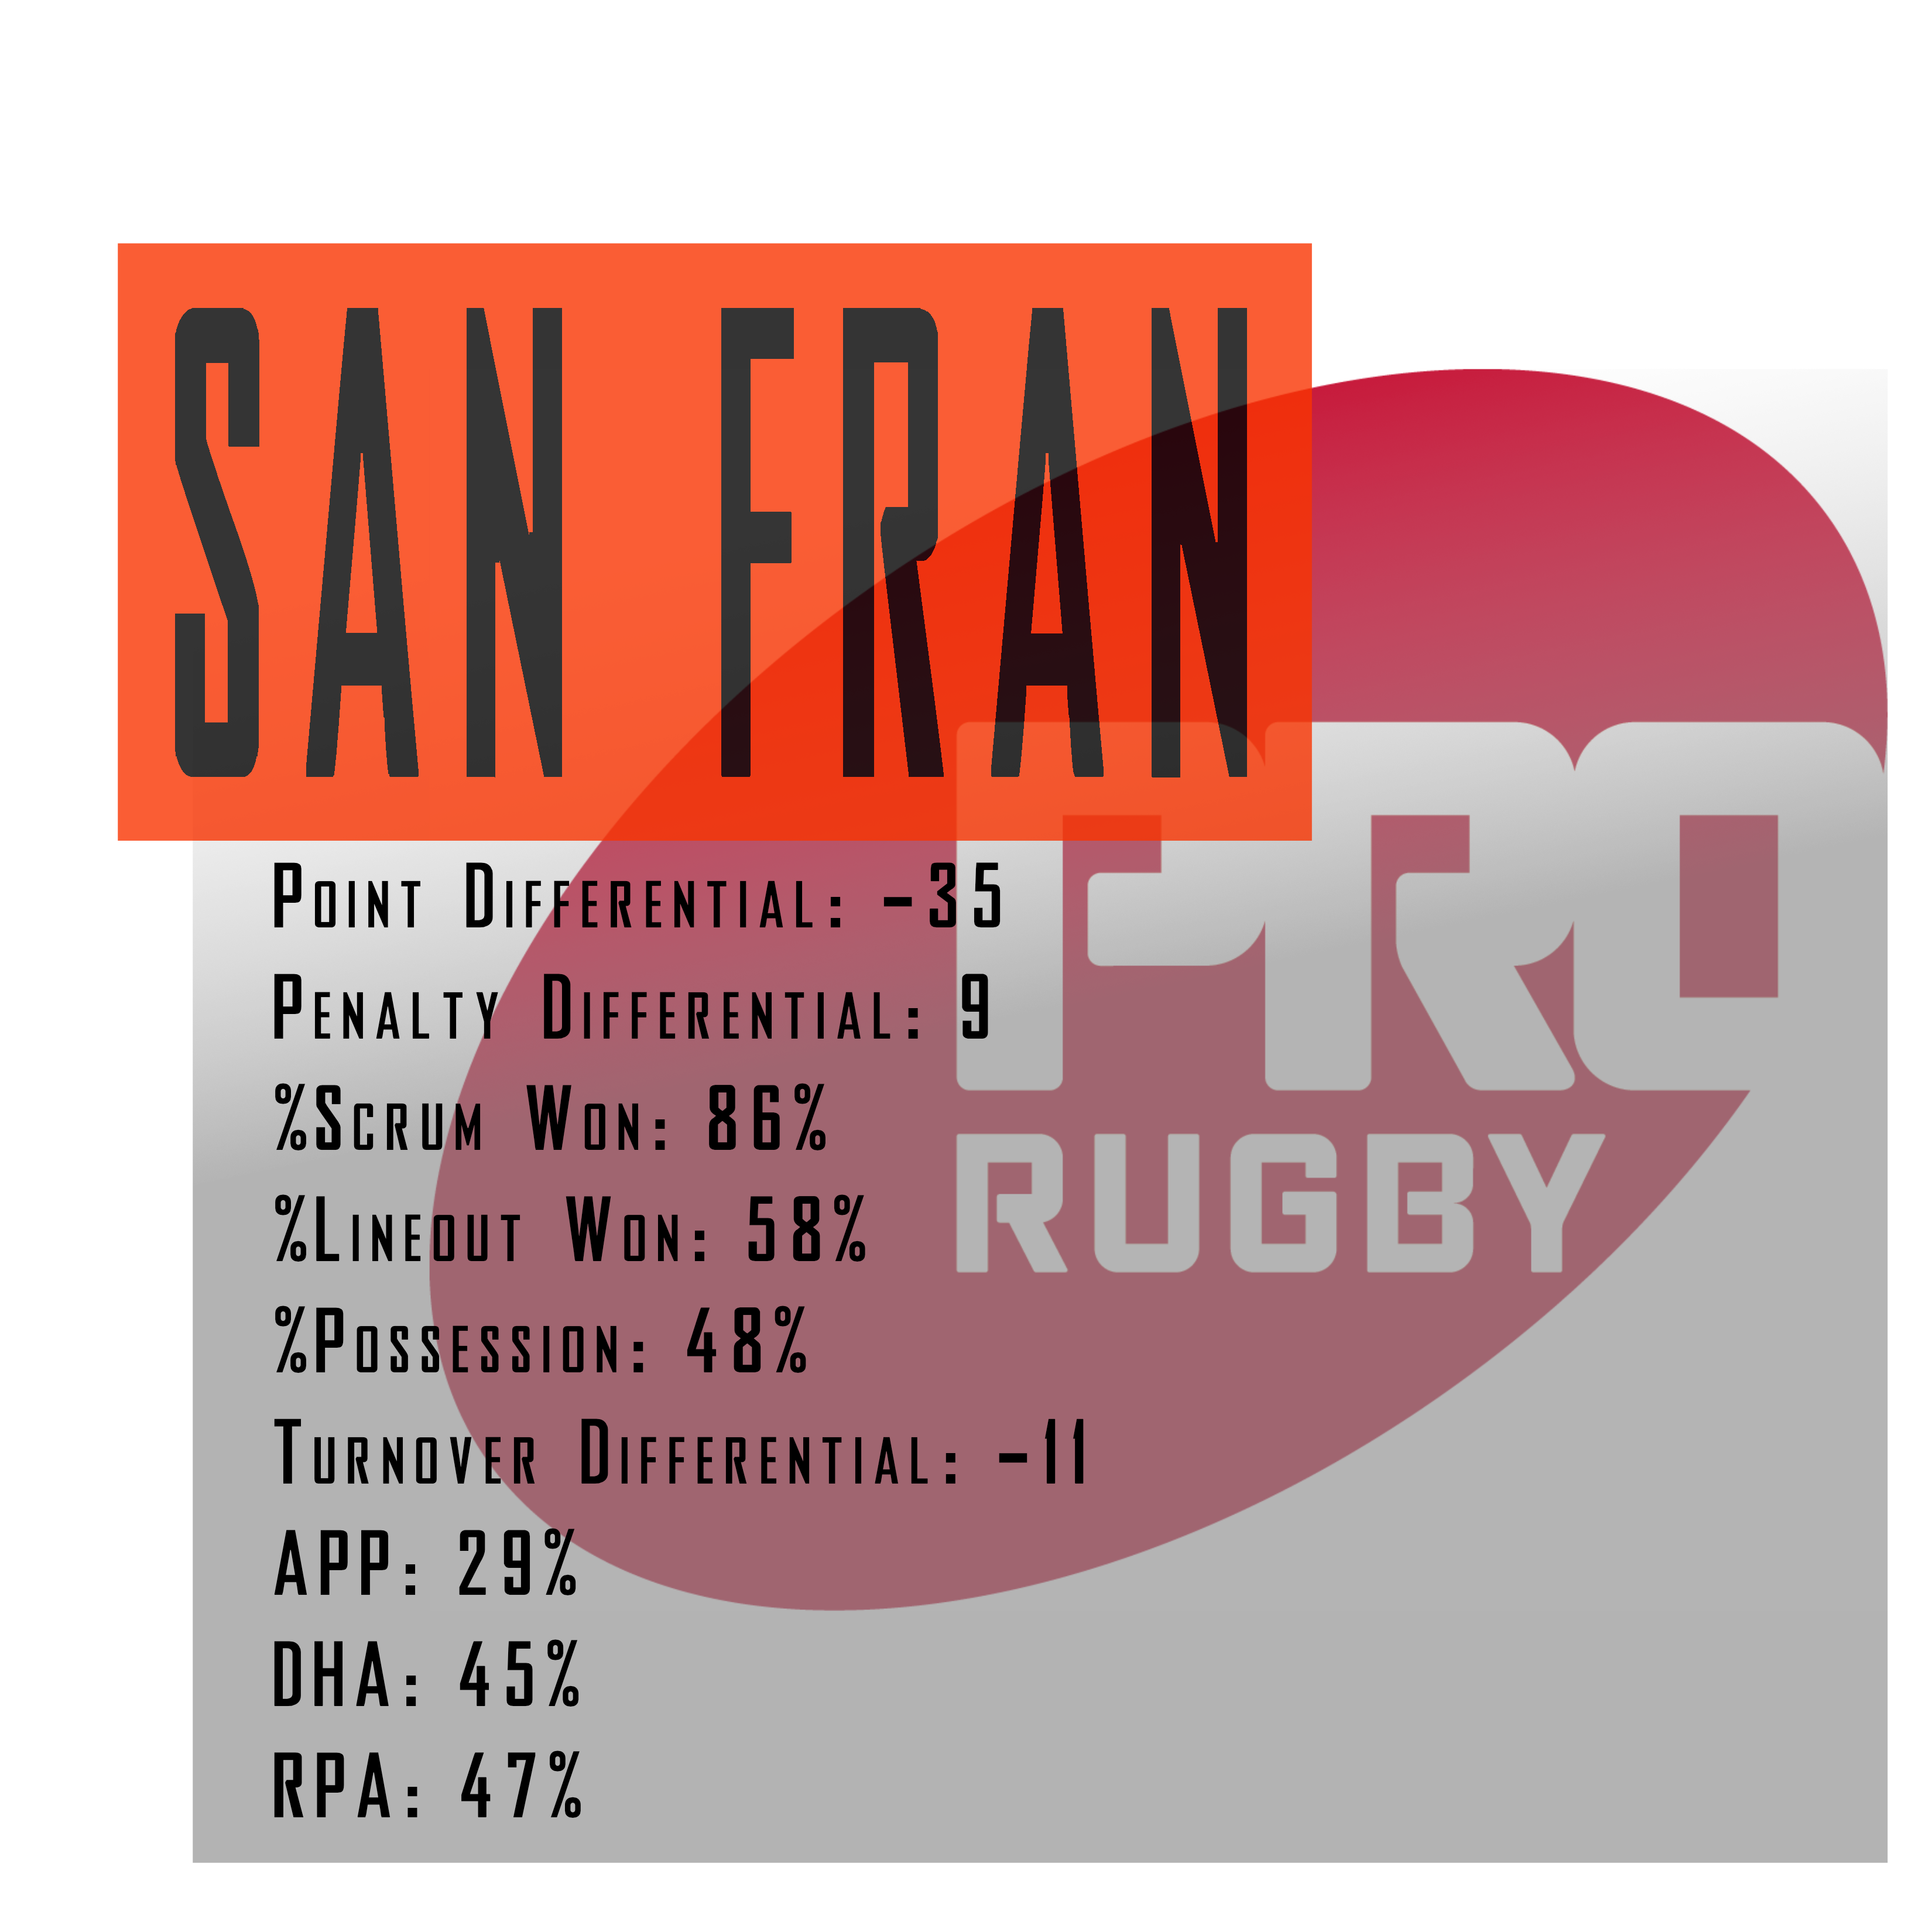
San Francisco also lacked in the turnover area with -11 and the league’s lowest RPA of 47%. The Rush showed plenty of potential this season with a win over the Aviators, but ultimately things did not fully come together often enough.
I’ll be back next year to cover the stats the whole season. Let me know if there’s anything else you want to see covered! In the meantime, take in these:


That’s all for now, please feel free to comment below, look for and “Like” our Facebook Rugby Wrap Up Pageand follow us on Twitter@: @RugbyWrapUp, @Luke Bienstock, @Junoir Blaber, @MeetTheMatts,@Ronan Nelson, @Zack Stryfeller, @Brian C Cole, @Garrett Harper, @James Harrington and @Declan Yeats.