 PHILADELPHIA, PA – It was a lot of rugby in not a lot of time, and the 2015 Pacific Nations Cup
is now all wrapped up. To be sure, this year’s tournament was better than last year’s in that it seemed like an actual tournament instead of just a few matches loosely tied together. While all of the coaches and sides had one eye on England and the World Cup, once each match started it was those 80 minutes that mattered. If you have any doubt about that, check out the answers to questions for USA Rugby Head Coach Mike Tolkin, lock Greg Peterson and flyhalf AJ MacGinty, exclusive to Rugby Wrap Up, by clicking here.
But this is about the numbers…
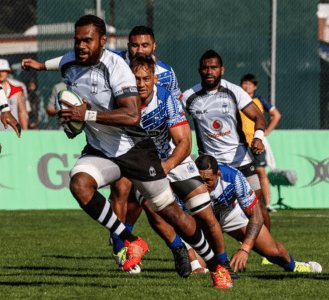
Watching Fiji v Samoa just made me want to watch more Fiji v Samoa. Can every match ever played be Fiji v Samoa?
Fiji and everyone in the Fiji camp will have to be pretty pleased with how things went. They scored 15 tries, the most in the competition, and looked sharp.
Japan can be pleased with some things – after all, it was just training sessions for Eddie Jones – but not with only winning one game.
Thanks to a stronger scrum and AJ MacGinty’s drop goal to beat Canada, things seem okay for the USA Eagles.
In terms of analysis and data, I wanted to treat the PNC as a warm-up for the World Cup. What numbers really help understand the game and the sides? What information is worth keeping track of, and what can be overlooked?
There were 12 PNC matches in all. First, we’ll tackle scrums, then lineouts, and tries at the end.
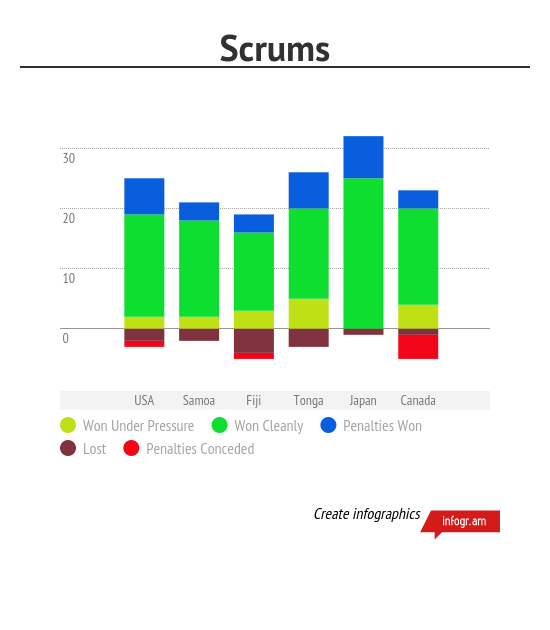
Here are the scrum totals by team:

Not surprisingly, Japan had the most efficient scrum. Tonga had a tough first match against Fiji, but then improved.
Canada had the least efficient scrum.
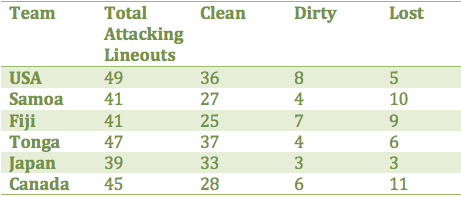
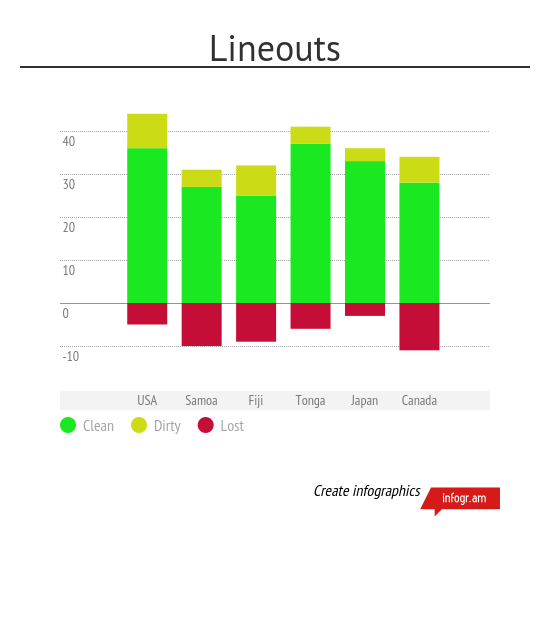
Here is a look at the lineout totals.
The USA is at the top of the table in terms of lineout opportunities. Japan, though, won more of their lineouts cleanly – relative to chances – and so also had the most efficient lineout. Canada had the least efficient lineout. Given these numbers, it is not surprising that Canada struggled in the tournament and failed to win a game.
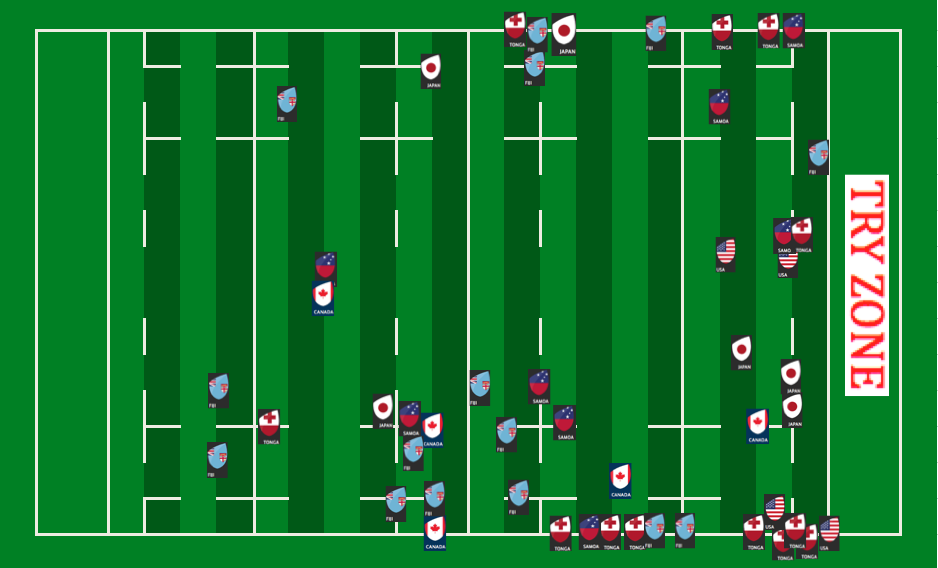
It is also interesting to see where the tries came from. Here is a picture with a national icon to show from where the possession started that resulted in a try. (Click to enlarge.)

Over the 12 matches, there were 53 tries scored. 20 of those came from possessions that started with a lineout (including one stolen lineout). Tonga, in particular, were lethal from the lineout; 10 of their 12 tries started from a lineout.
11 tries came from scrums; 8 from counter attack (when a team was kicked to); 5 came directly from turnovers.
The average starting distance from the try line for try-possessions was 32 meters.
25 tries were scored on the first phase; 7 on phase 2; 5 on phase 3. Tonga had a try that was the result of 21 phases, which is easily the highest total. Only 4 other tries came on double-digit phases.
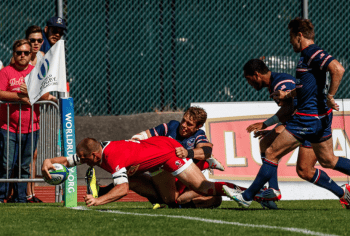
The fact that 25 first phase tries were scored suggests that offloads are more important than laborious ball retention. Looking at other teams, like Ireland and their focus on the quick ruck, it seems like this might not be a broad trend that carries over to the World Cup, but we’ll see.
I had come to believe that tries were more likely to be scored from turnover ball than set pieces. I don’t recall how I first encountered that notion – probably some casual comments from tv commentators – and it still may be true in general. It was not true, however, for this tournament.
If this tournament is typical, then lineouts are more valuable than I’d realized. In PNC rounds 2-4, a lineout in the attacking half had a 19% chance of leading to a try. The key does not seem to be that the lineout is all that close. The key is simply the lineout.
Scrums in the attacking half had a 14% rate for tries over the same games.
Over the course of the tournament, there were 82 penalties awarded to teams in the attacking half from which the attacking team did not choose to attempt a penalty kick.
58 (of the 82) times teams opted to kick to touch. Those decisions directly resulted in, in total, 74 points (or, 1.28 points per penalty).
24 (of the 82) times teams either took a tap or chose a scrum. Those decisions directly resulted in 26 points (or 1.08 points per penalty).
If what is sought is a sense of how valuable different actions are on the field, in terms of points, this information is important. For rounds 2-4, I have penalty data and goal kicking data, so the comparison can be made directly between returns for the penalty goals and other decisions.
The Goalkickers site has the probability for individual kicks, so it is possible to work out the expected return for penalty kick attempts from given locations. I have not yet done that for the PNC. In general terms, for rounds 2-4, there were 69 penalty kicks taken with 56 made. That is an 81% success rate. In broad terms, that means that the penalty kick chance was worth 2.43 points.
For the same games, 63 penalties won in the attacking half were NOT turned into penalty kick attempts. Those 63 penalties (kick to touch, tap, scrum) returned 86 points directly, or 1.37 points per penalty.
Simply winning the penalty inside the attacking half was worth 1.92 points.
Teams are more likely to kick to touch when the mark for the penalty is at the edge of their kicker’s range. Even though the lineout leads to more tries than any other type of event, kicking to touch from anywhere inside 40 meters for, say, Japan, with a pretty reliable Ayumu Goromaru, is like giving away a point.
It will be interesting to see how that number compares with data from a top league, like the English Aviva Premiership and, most of all, the World Cup.
That’s it… Feel free to comment below, look for and “Like” our Facebook Rugby Wrap Up Page and follow us on Twitter@: RugbyWrapUp, Jake Frechette, Junoir Blaber, James Harrington, Jamie Wall, Nick Hall, DJ Eberle, Scheenagh Harrington, Jamie Loyd, Cody Kuxmann, Karen Ritter, Audrey Youn, Akweley Okine, Rocky Brown and Declan Yeats, respectively.


