PHILADELPHIA, PA – While there is a lot to distract us from the recently concluded Americas Rugby Championship (Vancouver 7s, Super Rugby, 6 Nations, Aviva Premiership Match in America…), I am still trying to make sense of how the tournament went. It took a while before I was able to watch the Chile v Canada match, but now all of the stats are complete. This post looks at lineouts, scrums, tries, and goalkicking.
Lineouts
With attacking lineouts, the USA were the best side and had the most lineouts overall. The number of chances matters because the lineout is such an important attacking platform – more on that below. Lineouts inside 30 meters are particularly valuable, both as an attacking platform and as an indication of attacking pressure. Chile had the fewest lineouts inside 30 meters; Argentina had the most.
[supsystic-tables id=’38’]
In looking at how sides limited the success of their opponents, Argentina had the best defensive lineout. In this table, the lower the percentage, the better.
[supsystic-tables id=’39’]
Scrums
While things were tough for Chile at lineout-time, their scrum performed well. Chile only conceded 2 penalties from their attacking scrums the entire tournament. The USA and Brazil were both hurt, over the course of the tournament, by their scrum performance.
[supsystic-tables id=’36’]
Argentina and Uruguay clearly had the most effective defensive scrums. Argentina’s opponents had the most scrums, but Argentina was effective in limiting the attacking opportunities from those scrums and won 11 penalties on their opponents’ put-in. Uruguay was clearly better at ruining opposition possession than winning their own.
[supsystic-tables id=’42’]
Tries
How many of those lineouts and scrums led directly to tries? The table below shows that the simple answer is 40 and 21, respectively. Canada were the only side to score more tries from scrum possession than lineouts. Canada also scored the most tries (7) from 5 or more phases. Argentina were the most dangerous first-phase side.
This table shows how every possession that ended with a try started.
[supsystic-tables id=’40’]
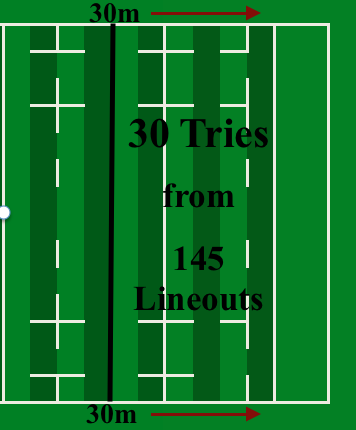
 Looking at the value of lineouts in the tournament, there were 145 lineouts 30 meters or closer from the try line. Those lineouts led directly to 30 tries. That is better than 1 in 5, about 21%, of lineouts within 30 meters led to a try. Losing a lineout inside 30 meters, therefore, is like losing a point (21% of the value of a try).
The USA’s successful lineout meant their return from those lineouts was better than the tournament average. The Eagles had 33 lineouts in this attacking section of the field and scored 10 tries from those. That is close to 1 in 3, 30%. In contrast, Chile had only 10 lineouts inside 30 meters and lost 4 of those. They did score 1 try from their 10 chances.
Here is a look at the tries conceded by each side.
[supsystic-tables id=’41’]
Goalkicking
Straight percentages are not the best way to evaluate goal kicking. But, it is a place to start. Next week, we’ll have the Goalkickers rankings for the tournament.
[supsystic-tables id=’43’]
Here are the simple percentages for all of the kickers with more than 10 attempts. Most of Pedro Mercerat’s attempts were conversions – Argentina did not attempt many penalty goals but scored a lot of tries. Overall, rates of conversions are lower than rates of penalties because teams can opt for a lineout when the mark is close to the touchline but must take the difficult conversions.
[supsystic-tables id=’44’]
And I am not quite done with this tournament! Soon, we will have a look at the individual kicker rankings, as well as the outcomes from every penalty won in the attacking half.
Feel free to comment below, look for and “Like” our Facebook Rugby Wrap Up Page and follow us on Twitter@: RugbyWrapUp, Junoir Blaber,James Harrington, Jamie Wall, Nick Hall, DJ Eberle, Jake Frechette, Scheenagh Harrington, Jamie Loyd, Cody Kuxmann, Karen Ritter, Ronan Nelson, Kaitlin McCabe, Kyle Phillips, Rocky Brown and Declan Yeats, respectively.

