


PHILADELPHIA, PA – New Zealand left little doubt they were the best side at the 2015 Rugby World Cup. Looking at the tries from the tournament reinforces their dominance. New Zealand scored the most tries overall, unsurprisingly. They finished with 39. Australia had 28, Argentina 27, and South Africa 26.
271 tries were scored in all. 80 tries came from possessions starting within 10 meters of the try line. 165 tries came from possessions starting 30 meters or closer. Here is the full breakdown that shows the value of territory.
An interactive map of all of the tries is here. You can sort by attacking side, defensive side, length, time, number of phases, and kind of possession.
The early pace of tries coming from lineouts slowed, but 45% of tries in the entire tournament came from possessions that started with lineouts. More tries came from lineouts than from any other kind of possession, and it isn’t close.
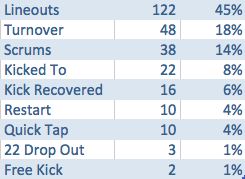
Even taking into account that there are far more lineouts than turnovers, lineouts were more likely to lead to tries than turnovers. Overall, 7% of turnovers led directly to tries. 10% of all lineouts led directly to tries. The All Blacks outperformed in these categories, as with most. According to World Rugby, New Zealand won 54 turnovers in the tournament; those led directly to 7 tries. 13% of New Zealand turnovers directly led to tries. South Africa actually had precisely the same numbers from turnovers.
New Zealand had 87 attacking lineouts; those led directly to 16 tries. That is 18%; a better return than from turnovers. No other side had a better rate of return. Australia scored 17 tries from lineouts, but they had more lineouts. New Zealand also tops the list for tries from scrums (9).
Taking into account events from all field locations, lineouts were more likely to lead to tries than scrums. But if we look at scrums and lineouts occurring within 30 meters of the try line, scrums are more valuable. In a broad sense, the lineout is the king, but the details, like territory, matter.
From scrums 30 meters or closer, tries were scored 20% of the time. In other words, teams with an attacking scrum within 30 meters scored a try 1 out of 5 times. Additionally and importantly, 22% of scrums in this “attacking zone” ended with the attacking team winning a penalty. Most of those penalties had a high likelihood of becoming made penalty goals. And for that same set of scrums, the attacking side conceded a penalty only 7% of the time. South Africa won the most penalties (5) in that area of the field while conceding none.
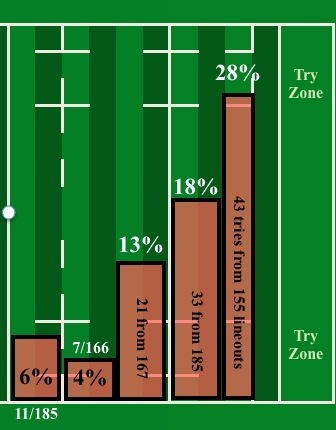
19% of lineouts 30 meters or closer resulted in a try. I did not track how many of those lineouts and the resulting possessions resulted in penalties, but my hunch – one educated by watching every match and tracking all the other data – is that the rate of penalties is far below the 22% from the scrums. That means that scrums in this area of the pitch are more likely to be turned into points than lineouts.
If we narrow the range to within just 10 meters of the try line, 28% of lineouts led to tries.
As covered before, the meters inside the 22 matter. There was a real drop in the occurrence of tries from lineouts within 10 meters and lineouts between 11 and 22 meters. There was another drop off again in the 23-30 meter zone. The image below captures easily the value of territory.
Those returns look pretty good, but less impressive when compared to the scrum data. Again, the value of territory is clear, though the details are different. Scrums within 10 meters are nearly twice as likely to lead directly to tries as scrums between 11 and 22 meters.
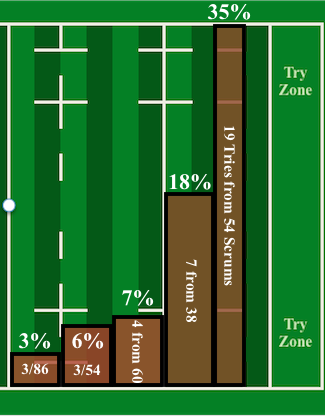
From this, it is pretty clear that a 5 meter scrum is more valuable than a 5 meter lineout. The figures in the image above are just about tries and don’t take into account attacking scrums that became made penalty goals.
If the World Cup data is representative of international rugby in general and professional club rugby, sides should opt for scrums from penalties won inside 10 meters much more often than lineouts. Of course, we don’t yet know if the data is representative, and decisions will always need to consider the strength of the side’s lineout and scrum (and goal kicker).
Again, the map of the tries is here. One thing that I found slightly surprising was the number of phases needed to score for possessions starting close to the try line.
The story of the penalty goals is here. This can be sorted by type of penalty goal attempt, time, etc.
I will be adding more to Tableau in the next few days.
That’s it… Feel free to comment below, look for and “Like” our Facebook Rugby Wrap Up Page and follow us on Twitter@: RugbyWrapUp, Jake Frechette, Junoir Blaber, James Harrington, Jamie Wall, Nick Hall, DJ Eberle, Scheenagh Harrington, Jamie Loyd, Cody Kuxmann, Karen Ritter, Audrey Youn, Akweley Okine, Rocky Brown and Declan Yeats, respectively.