 PHILADELPHIA, PA – Referees who stop a player from taking a penalty quickly are like my dog refusing to pass a bush without peeing on it. “Everyone needs to know I am here!”
One of the things that I have learned during the 40 pool matches of the 2015 Rugby World Cup is that the referee’s mark is an imprecise thing. Because I have been trying to log the location of penalties, scrums, and lineouts, the referee’s mark has become important to me. And when you pay enough attention, you quickly notice that where a knock on or penalty occurs is often not where the mark is given.
All of this is no big deal except for two things: marks for kicks at goal and quick taps. In a few instances, like from a penalty at a scrum, taking the tap from the wrong spot can create a real advantage over taking the tap from the mark. However, most of the time, the pedantry of the referee (“Wait! I did not give you the mark.”) serves only to slow play down and kill inventiveness on the pitch. This is especially grievous since most referees aren’t that good at getting the mark right to begin with.
On to the data updates!
Several different interactive tables and infographics are linked to at the end.
TGA: Worth Keeping?
At the start of the World Cup, I wrote about TGA (Territory Gained Average): the average amount of territory teams gain from kicks to touch from penalties. Adjusted TGA removes kicks taken within 25 meters of the attacking try zone. In other words, the adjustment is to remove kicks whose distance is necessarily limited by field position.
In terms of individuals, Ayumu Goromaru is the best, with a 35.1 ATGA.
Florin Vlaicu had several touch-finding bombs, including 2 that were 50+.
Another individual performance that stands out? Bernard Foley is better, in this aspect of play, than Quade Cooper. Foley has an ATGA of 29.5 while Cooper’s is 23.6. Combined with a Goalkickers Rating of 6.080 for Foley and 2.070 for Cooper, the selection discussion is pretty much over if Australia want a 10 who can kick from hand for territory and kick from the tee. Only the skills of Matt Giteau (who can do the job of 12 plus lots of things a 10 would do) would seem to make this a plausible debate.
For teams, though, TGA and even Adjusted TGA didn’t line up closely with wins.
But we know territory is important, so another way to look at these kicks to touch is Exit TGA, which is the average of kicks to touch from inside the defensive 22. These kicks are important because they are taking a team out of a dangerous area. Moving playing, say, from 80 meters to your attacking try zone to 40 meters to your attacking try zone significantly alters the scenario of outcomes from the resulting lineout.
The average territory gained, from all kicks to touch taken inside the defensive 22, was 28 meters. If your side wins a penalty on the 22, you can expect the lineout right around halfway. Better than that, and your touch-finder is adding value to your side. Much worse than that, and your touch-finder is hurting your side.
6 of the 8 Quarterfinalists are at the top of the Exit TGA table. Wales are still better than average. The Exit TGA might be the most important number in the end.
The full interactive table for teams is here. Click to sort by the different averages.
Attacking Lineouts
The decision to kick to touch from a “kickable” position is a big deal. If the penalty goal attempt is made or missed, that matters. If the kick to touch is good or poor, that also matters. In order for the penalty to turn into a try, which is the goal, getting the kick close to the try line matters. Being between 5-10 meters for a lineout significantly increases the likelihood of scoring a try.
Here are the updated numbers for attacking lineouts.
If we split the 22 into just 2 parts, here is what we see. If a team “goes for the corner,” they are much better off if they get there.
Punting the ball into the corner to give a team a lineout on or right next to that 5 meter mark may not be as exciting or scream-inducing as a David Pocock turnover, but it might be even more important.
Every try from pool play is here.
You can sort by Attacking Team, Opposition, Possession Started With…, and Length.
You can sort by Made/Missed, Penalty/Conversion, Attacking Team, Kicker, Length, and Width. A little playing around reveals a predictable and pleasing “V” pattern from the conversions.
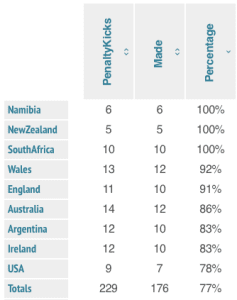
Here are all of the goal kicking numbers in a table. In terms of penalties, 77% were made in total. Here is a picture that shows the teams whose percentage was better than average.
All data is from RWC 2015 and collected by me and Somye Goyal.
That’s it… Feel free to comment below, look for and “Like” our Facebook Rugby Wrap Up Page and follow us on Twitter@: RugbyWrapUp, Jake Frechette, Junoir Blaber, James Harrington, Jamie Wall, Nick Hall, DJ Eberle, Scheenagh Harrington, Jamie Loyd, Cody Kuxmann, Karen Ritter, Audrey Youn, Akweley Okine, Rocky Brown and Declan Yeats, respectively.


